From SanMateo County: https://www.smchealth.org/coronavirus
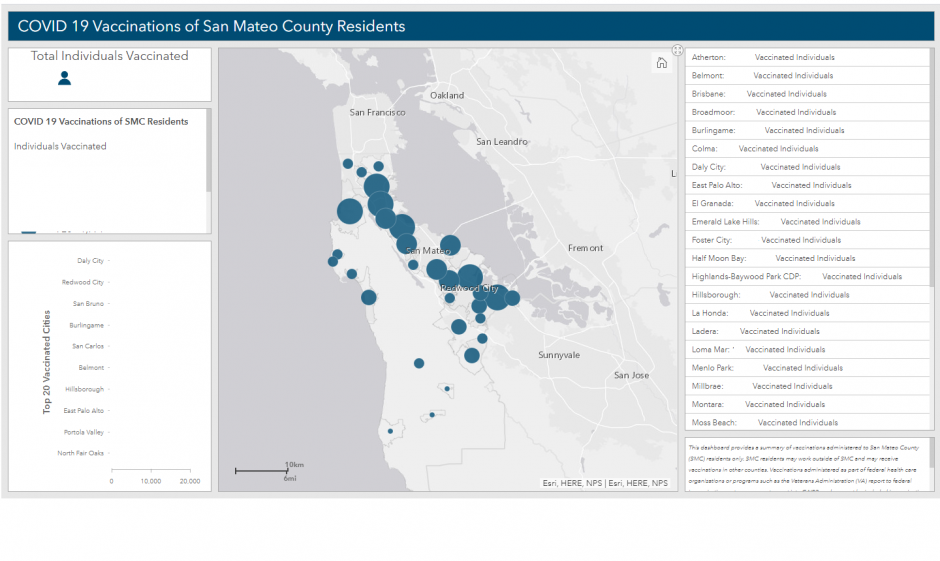
VACCINATION TOTALS & LOCATIONS DATA
Data are preliminary and subject to change. This dashboard is updated at the close of business on Tuesdays and Fridays.
The vaccination rates displayed are capped at 95% to help address potential over-estimates of vaccination coverage. While the issue of over-estimates is much more noticeable for the highest percentages, all vaccination data shared are imprecise due to data limitations.
Data are preliminary and subject to change. This dashboard is updated at the close of business on Tuesdays and Fridays.
Data are preliminary and subject to change. This dashboard is updated at the close of business on Tuesdays and Fridays.
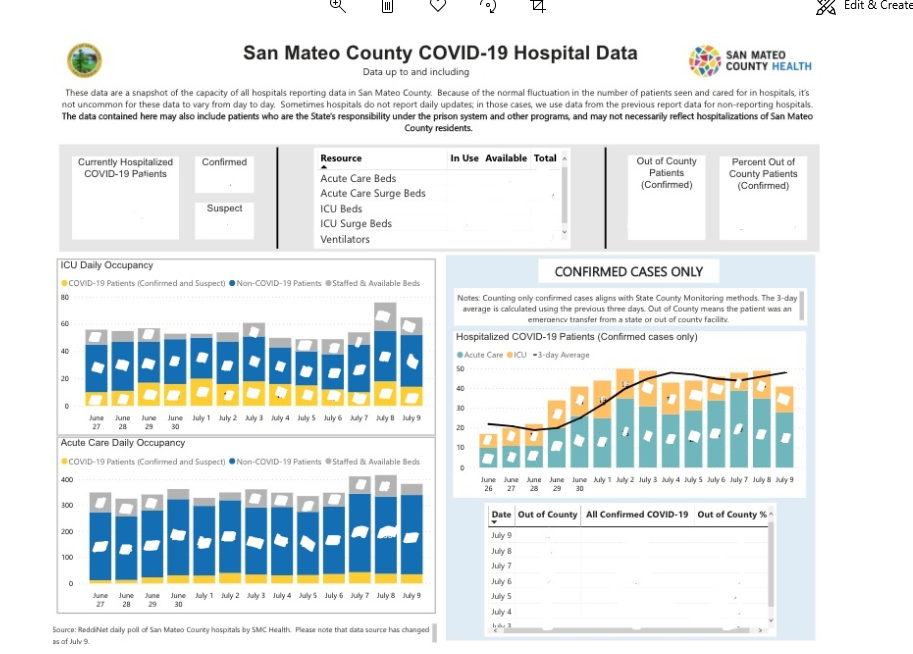
Data are preliminary and subject to change.
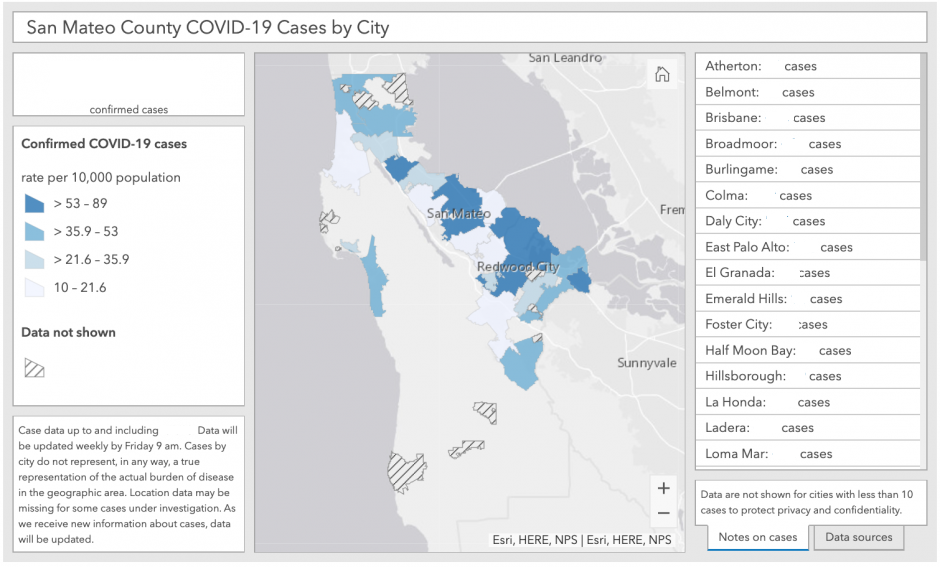
This map breaks down the number of confirmed COVID-19 cases in San Mateo County by city and census tract and is updated once a week on Fridays.


